Data analysis

In recent years, "business intelligence" and "analytics" have evolved from their niche for corporate controllers through strategic decision-making into operational business. Nowadays, it is almost impossible to make any decision without analytics.

At the same time, analytics is a very complex field: it might come as a simple report on multidimensional business data, as a real-time dashboard, or as Big Data and the analysis of IoT sensor data. In addition, visualisation, processing and forecasting via artificial intelligence are important topics.

The sheer mass of analytical solution providers has not made tool selection any easier in recent years. On the one hand, there are the software giants such as Microsoft, SAP and Google. On the other side, there are visualisation specialists like Tableau or providers for small businesses that want to offer a simple analysis process.

From our many years of experience, we at bi excellence software GmbH can say that it is precisely this area of tension that poses a great challenge for medium-sized companies: For them, the large software packages are often too complicated and associated with too high costs - on the other hand, they also do not have simple analysis processes, but very explicit and complex requirements for the analyses.
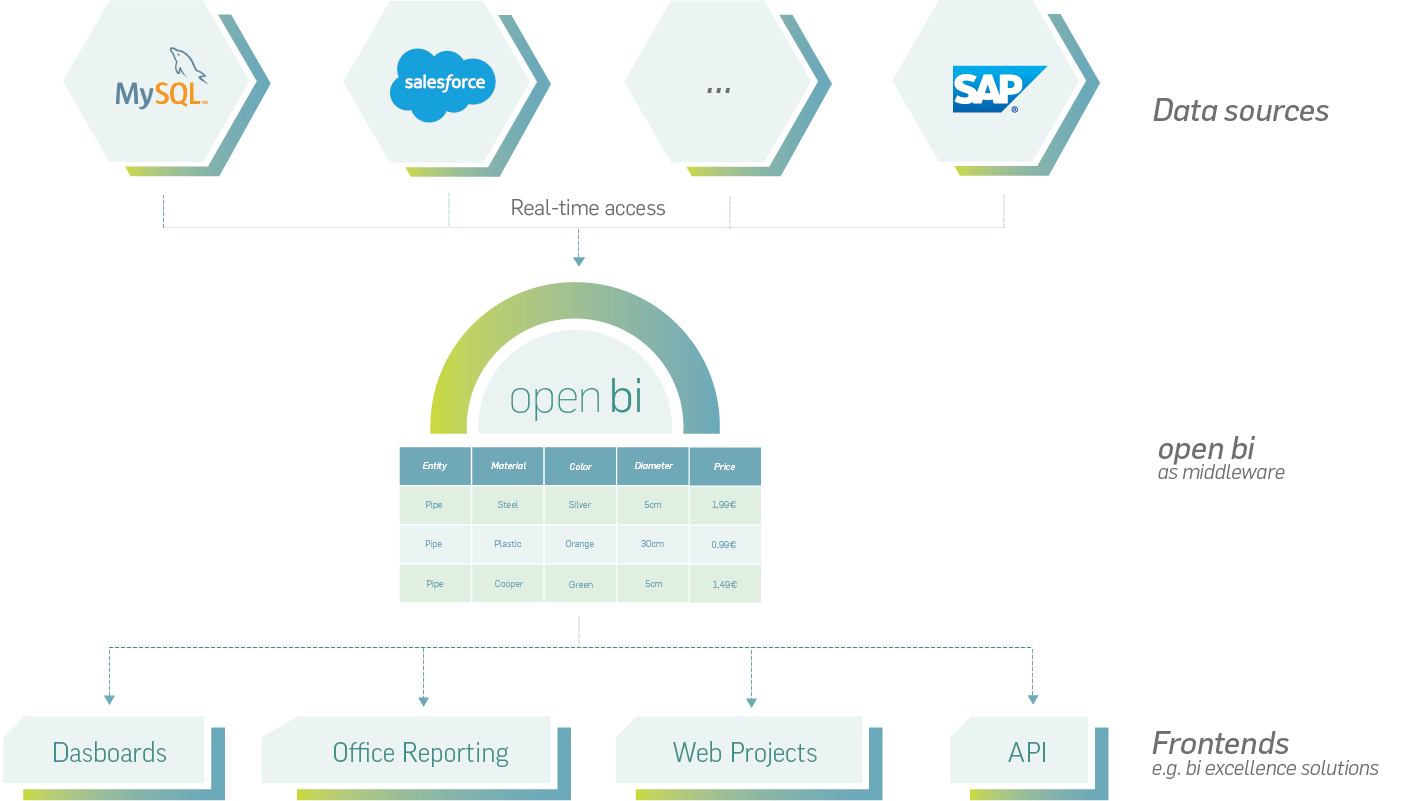
Middleware

Fully integrated data analysis Made in Germany

This was reason enough for us to offer our own analytics for open bi. A solution that:

  • is completely self-developed and "Made in Germany"
  • is fully integrated into open bi, i.e. can be used by all other functions such as open bi CMS and Artificial Intelligence
  • not only allows visualisation of data, but also does the sourcing, processing and enrichment
  • is easy to use, but still offers all the specialities needed for comprehensive reporting, even in medium-sized companies
Made in Germany

This is what makes our data analysis unique

Data organisation

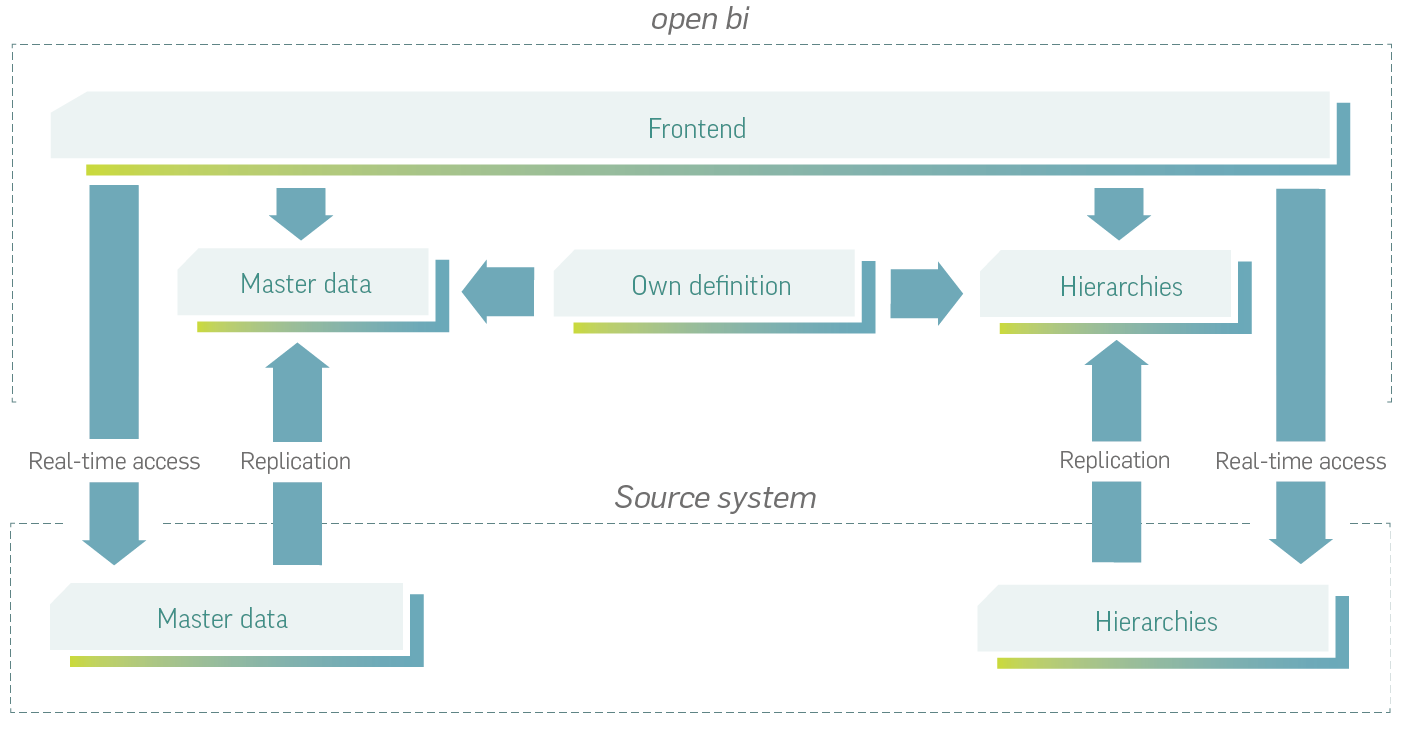
  • Master data can be read from the source systems in real time or replicated for more efficient processing. It may also be supplemented with attributes by open bi, or entirely newly created there
  • Hierarchies can be reused from the source systems, or created ad-hoc in open bi to add additional analytical perspectives through multiple hierarchy levels
Data organisation

Data connectivity

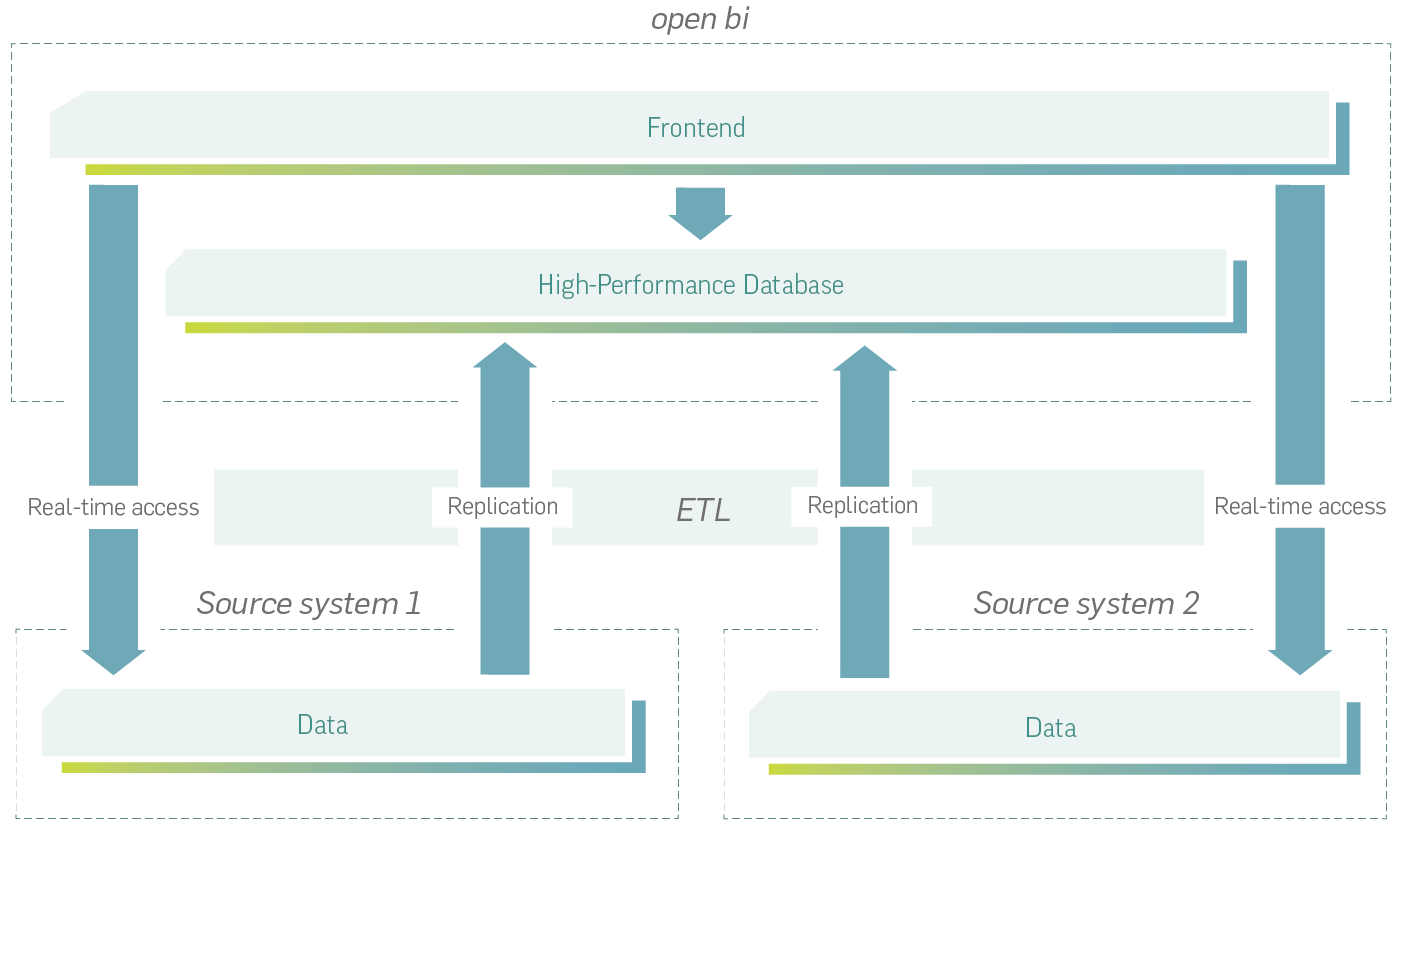
  • Support for hundreds of data sources: open bi can serve as an integrator of a wide variety of sources
  • Real-time access to data sources: The data remains where it originates and does not need to be replicated
  • Possibility of replication: If the data source is not designed for Big Data analyses, the data can be replicated into our high-performance database using ETL
Data connectivity

Data preparation

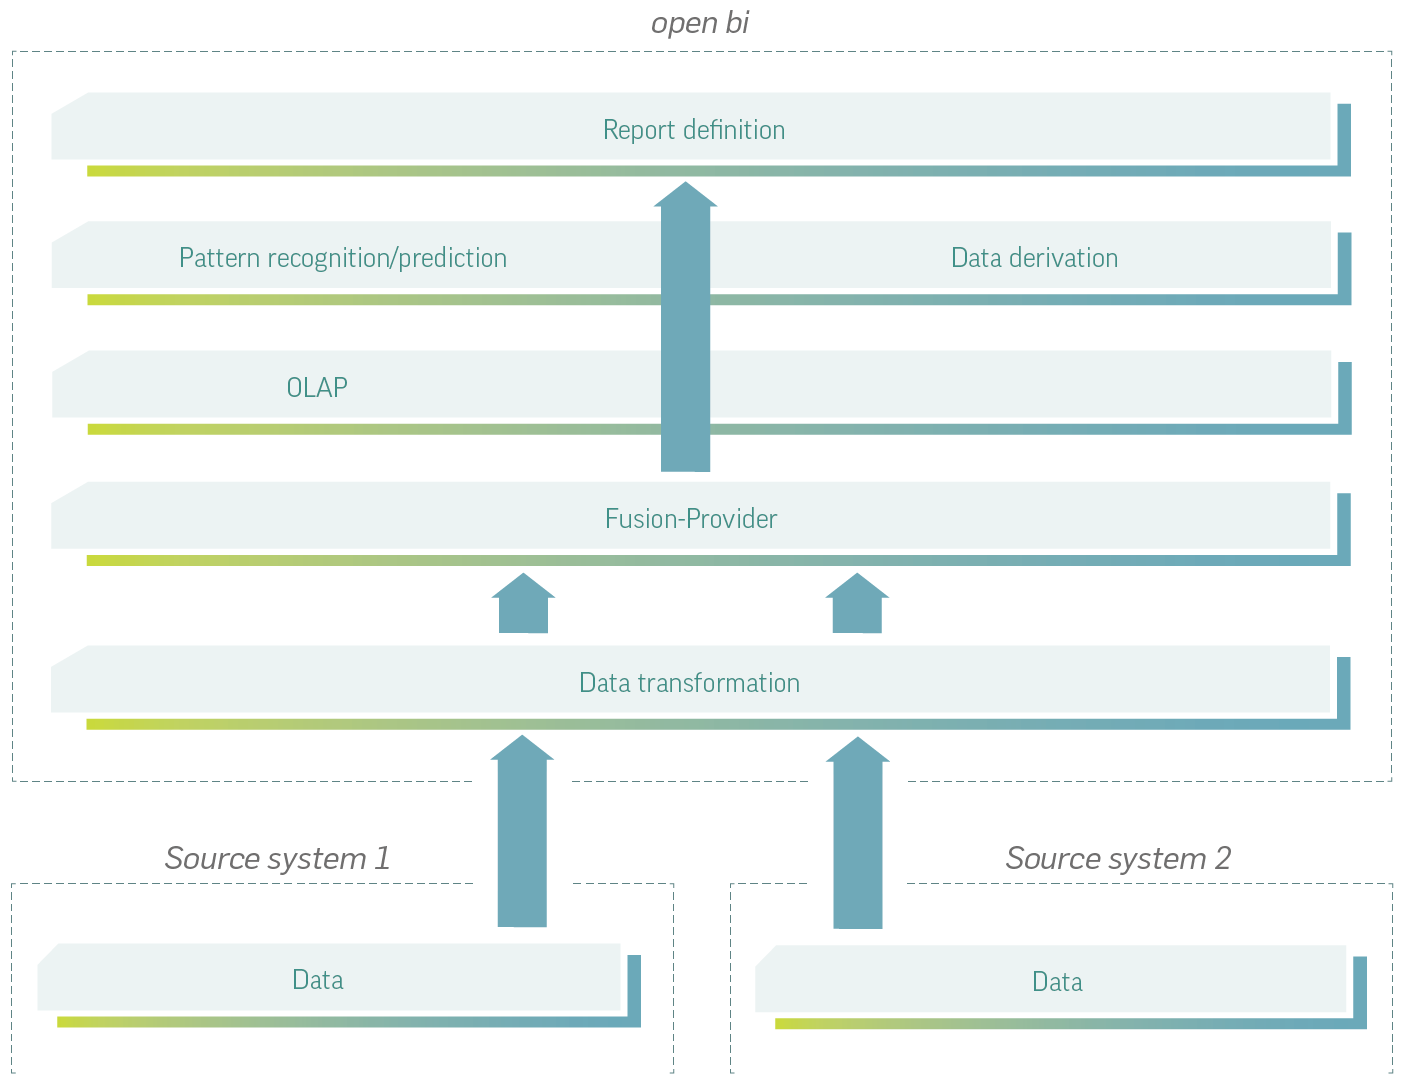
  • Own-developed OLAP processor: For high-performance and functional multi-dimensional analysis
  • Connection of data from different systems: Via our fusion provider, data from different systems can be connected in order to compare them in a report or to calculate KPIs
  • Possibility of data derivation: By means of calculated dimensions and calculated key figures, new insights can be gained automatically from available data. The aggregation behaviour of key figures can be changed and even frozen independently of the view by the means of a "constant selection". Even data classifications can easily be realized in this way!
  • Possibility of data transformation: Data can be edited freely to prepare it for a specific analysis need
  • Pattern recognition and prediction: Via different common predictive methods and artificial intelligence, dependencies can be recognised automatically and predictions can be made
Data preparation

Data consumption

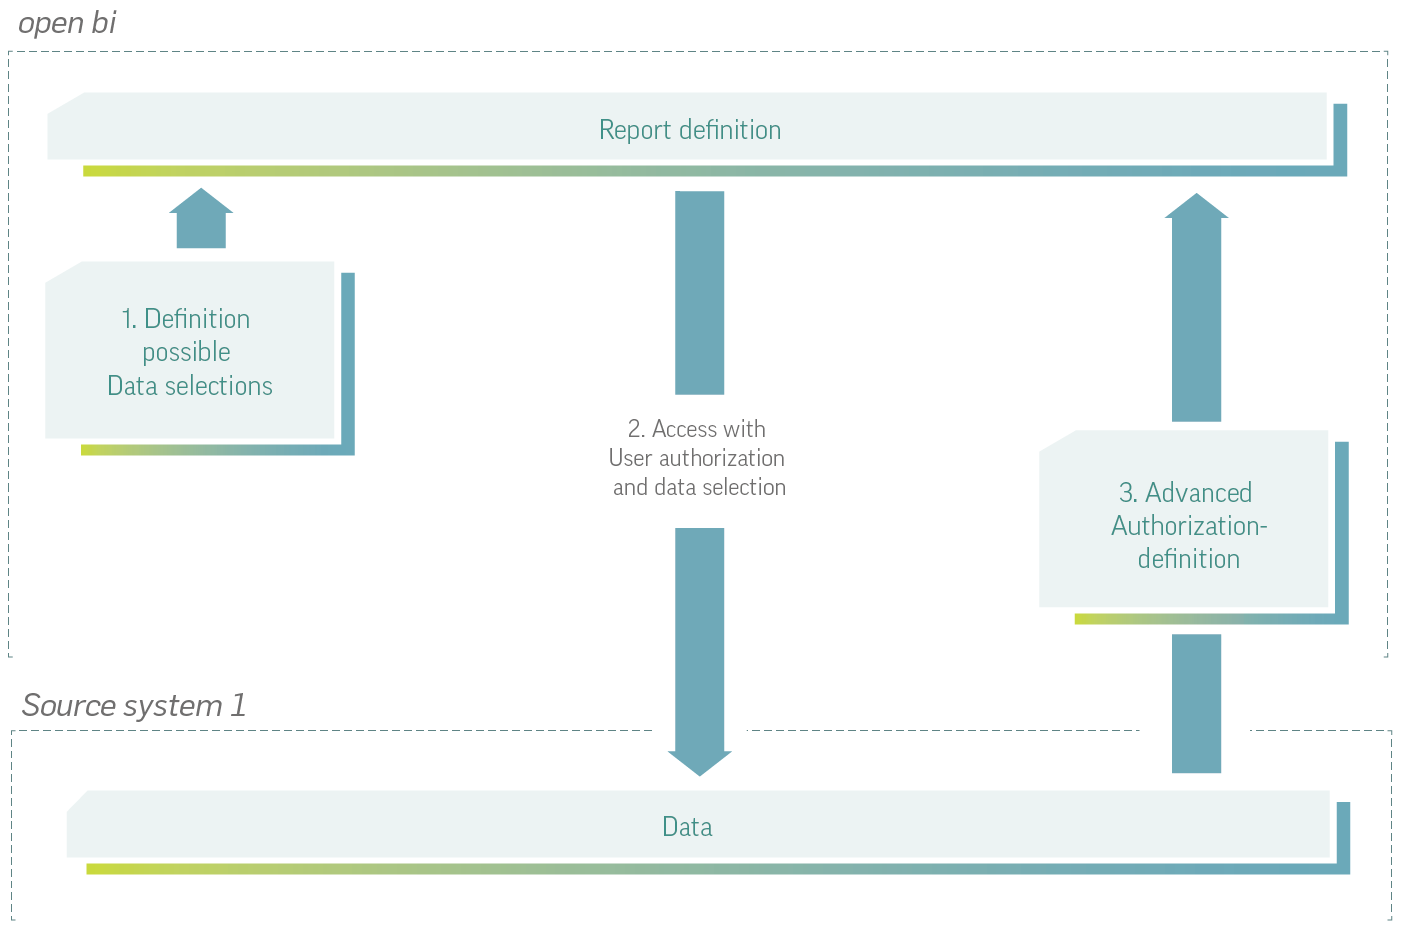
  • Permissions can be reused from the source systems. Here, the authorisation in the source system determines which reports and views the user is allowed to see. If the authorisation of the source systems is not sufficient, additional authorisations can be modelled in open bi at report or dimension level
  • System-independent user selections: The creator of a report can select characteristics for which report consumers receive a popup querying for an initial filter when executing
  • Easy consumption of data and analytical features across all functions of open bi: Via the APIs, from the Artificial Intelligence or in dashboards and web pages (using the HTML items of the open bi CMS)
Data consumption